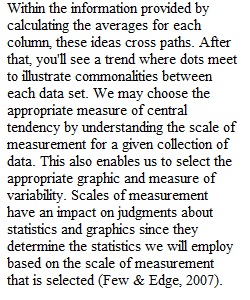
Q Overview As you learned in the Module Two Activity: Descriptive Statistics Quiz, thinking critically about your data and taking appropriate statistical approaches is what will enable you to perform the right calculations to draw appropriate conclusions. To prepare for Project One, in this milestone you will get to know your Project One data. This assignment will ensure that you are set up for success on your project, so make sure you review your instructor feedback thoroughly before submitting Project One, due in Module Four. Your textbook notes that scales (e.g., Likert-type scales) are often treated as if they are interval in applied statistics for the psychological and social sciences. This is true, and, as noted in your text, it is an area of debate even among those who do statistics regularly in these areas. We will, on occasion and for instructional purposes, follow this practice; however, for this assignment we want you to provide the most technically correct responses for all of these items—not indicate how data might be treated in practice. In your textbook, you learned that as scales of measurement become more numeric in nature, you have more options for measures of central tendency and variability because you can perform more mathematical operations. As you respond to the prompt, we would like you to select the measures of central tendency or variability that require the most mathematical computation that is reasonable to report, given the scale of measurement. For example, if your data were interval or ratio, you can report a mode, a median, or a mean, but the mean would be the measure of central tendency that requires the most mathematical computation. Thus, we would want you to report “Mean” as the answer for a variable measured on such a scale. Prompt For this milestone, you will submit a Word file. You will complete your milestone using your Soomo writing template and the data set provided in Soomo. Specifically, you must address the following rubric criteria: 1. Identify the scales of measurement for each variable. A. For the purpose of identifying scales of measurement, use (1) Nominal, (2) Ordinal, or (3) Interval and/or Ratio as accurately as possible. 2. Identify reasonable measures of central tendency, given the scales of measurement for each variable. A. For the purpose of identifying measures of central tendency, use (1) Mean, (2) Median, or (3) Mode. 3. Identify reasonable measures of variability, given the scales of measurement for each variable. A. For the purpose of identifying measures of variability, use (1) Range/Interquartile Range, (2) Standard Deviation/Variance, or (3) None. 4. Identify reasonable graphic depictions, given the scales of measurement for each variable. A. For the purpose of identifying graphic depictions, use (1) Bar/Pie or (2) Histogram. 5. Describe how these concepts intersect and why scales of measurement influence decisions about statistics and graphics. The length of your description must be about 4 to 7 sentences. Guidelines for Submission You will use your Soomo writing template to complete the milestone and download it for submission. Project One Milestone Rubric Criteria Exemplary (100%) Proficient (85%) Needs Improvement (55%) Not Evident (0%) Value Scales of Measurement Exceeds proficiency in an exceptionally clear, insightful, sophisticated, or creative manner Identifies the scales of measurement for each variable Shows progress toward proficiency, but with errors or omissions; areas for improvement may include details related to identifying the scales of measurement Does not attempt criterion 18 Measures of Central Tendency Exceeds proficiency in an exceptionally clear, insightful, sophisticated, or creative manner Identifies reasonable measures of central tendency, given the scales of measurement Shows progress toward proficiency, but with errors or omissions; areas for improvement may include details related to identifying the measures of central tendency Does not attempt criterion 18 Measures of Variability Exceeds proficiency in an exceptionally clear, insightful, sophisticated, or creative manner Identifies reasonable measures of variability, given the scales of measurement Shows progress toward proficiency, but with errors or omissions; areas for improvement may include details related to identifying the measures of variability Does not attempt criterion 18 Graphic Depictions Exceeds proficiency in an exceptionally clear, insightful, sophisticated, or creative manner Identifies reasonable graphic depictions, given the scales of measurement Shows progress toward proficiency, but with errors or omissions; areas for improvement may include details related to identifying the graphic depictions Does not attempt criterion 18 Intersect Exceeds proficiency in an exceptionally clear, insightful, sophisticated, or creative manner Describes how these concepts intersect and why scales of measurement influence decisions about statistics and graphics Shows progress toward proficiency, but with errors or omissions; areas for improvement may include details related to how concepts intersect and why scales of measurement influence decisions Does not attempt criterion 18 Articulation of Response Exceeds proficiency in an exceptionally clear, insightful, sophisticated, or creative manner Clearly conveys meaning with correct grammar, sentence structure, and spelling, demonstrating an understanding of audience and purpose Shows progress toward proficiency, but with errors in grammar, sentence structure, and spelling, negatively impacting readability Submission has critical errors in grammar, sentence structure, and spelling, preventing understanding of ideas 10 Total: 100%
View Related Questions